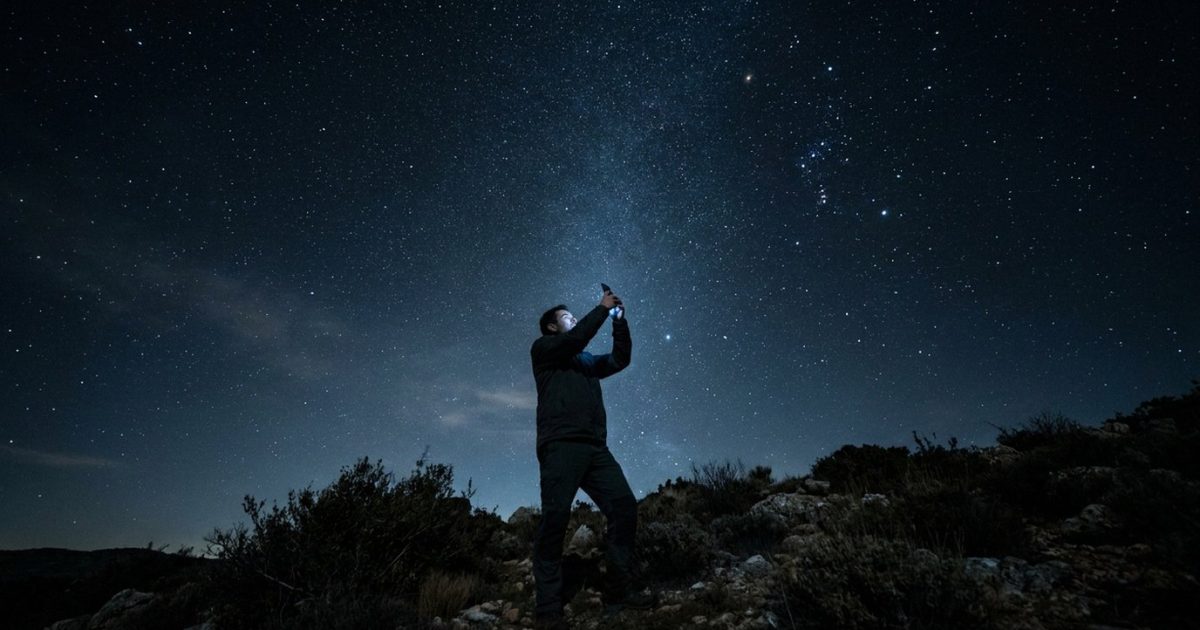
Globe at Night is the most widely used citizen science programme for measuring light pollution — over 300,000 observations from 180+ countries since 2006, and the direct data source for Kyba et al. (2023, Science 379: 265–268), which documented sky brightness increasing at 9.6% per year across 2011–2022. No telescope. No Sky Quality Meter. One smartphone and ten minutes on a clear, moonless night. Here is how to participate, what the method actually measures, and where your data ends up. For the broader instrumentation context, see our overview of light pollution measurement methods.
What Globe at Night Is
Globe at Night is a coordinated global sky-brightness monitoring programme built on naked-eye constellation observations — operated by NOIRLab, the US NSF’s National Optical-Infrared Astronomy Research Laboratory.
The programme launched in 2006. It is coordinated by astronomer Connie Walker and her team at NOIRLab, with outreach partnership from the International Astronomical Union (IAU). The premise is direct: visible stars are a proxy for sky brightness. A sky bright enough to wash out magnitude-5 stars but not magnitude-4 stars has a measurable and reproducible brightness range. Asking large numbers of observers worldwide to report which stars they can see builds a global map of stellar visibility that no fixed instrument network could afford to replicate.
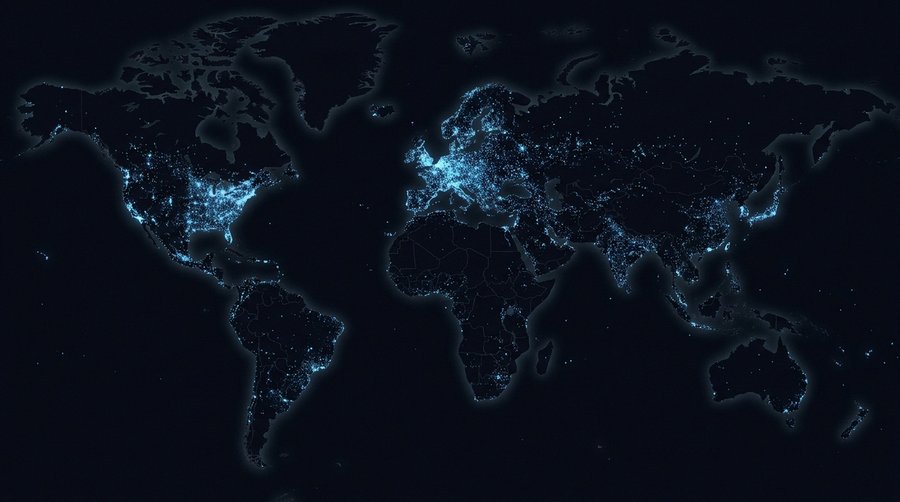
Observations are organised into ten-day campaigns, timed around each month’s new moon when the lunar contribution to sky brightness is minimal. Each campaign nominates a target constellation appropriate to the season. The database now holds over 300,000 individual submissions spanning 180+ countries — the density and geographic breadth that made it possible for Kyba et al. (2023) to conduct a statistically valid 11-year trend analysis. That analysis found stellar visibility declining at a rate consistent with sky brightness increasing by 9.6% per year — a result that satellite data, with its spectral blindspot for LED blue emissions, had failed to detect. For the full analysis of what those numbers mean and how the satellite-versus-citizen comparison works, see our article on the Falchi 2016 and Kyba 2023 data explained.
How the Measurement Works
The method is called naked-eye limiting magnitude — NELM — and it uses constellation-matching against calibrated reference charts to estimate sky brightness without any instrument.
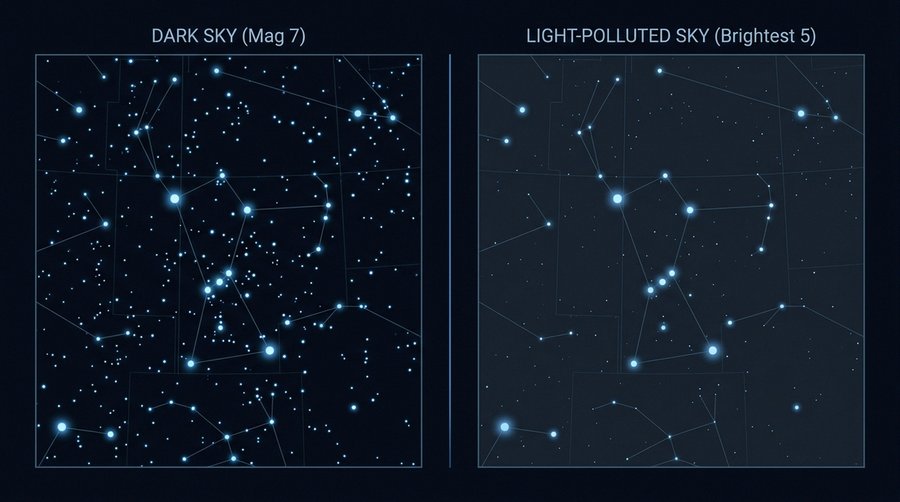
Each Globe at Night campaign selects a target constellation based on seasonal visibility. The annual rotation runs roughly: Orion (winter), Leo (spring), Cygnus (summer), Pegasus (autumn). For each campaign, the programme provides eight reference chart templates for that constellation. The charts are identical in constellation shape but differ in how many stars are shown — from the few brightest only, down to stars of progressively fainter magnitude. Chart 1 shows only the brightest few; Chart 7 or 8 shows everything visible under a pristine dark sky.
The observer steps outside, dark-adapts, finds the target constellation, and selects the chart that most closely matches what they see. The matched chart number corresponds to a naked-eye limiting magnitude value — the faintest star magnitude the observer’s eye can detect at zenith under those conditions. NELM converts to a sky quality meter equivalent via a lookup table, typically expressed in mag/arcsec². The match is subjective: two skilled observers at the same site on the same night may differ by ±0.5 magnitudes. That variance is the method’s limitation — and why 300,000 observations produce a reliable aggregate where any single reading cannot. For instrument-based alternatives including SQM and TESS-W, see our SQM buyer’s guide.
A NELM of 6.5 corresponds to roughly 21.3 mag/arcsec² — a rural-transitional sky. A NELM of 4.0 corresponds to about 18.0 mag/arcsec² — deep urban. The Bortle scale maps directly onto this range.
The Tutorial: Step by Step
Six steps, ten minutes total, no equipment beyond a smartphone with GPS.
Step 1 — Check the campaign window. Go to globeatnight.org and confirm the current campaign is active. Campaigns run for ten days around each new moon. Outside that window, submissions are not collected.
Step 2 — Dark-adapt for 15–20 minutes. Go outside away from direct artificial lighting. Avoid screens and white lights. The human eye’s scotopic sensitivity — rod-based low-light vision — takes 15 minutes to activate and reaches near-full sensitivity at 20–30 minutes. Skipping this is the single most common cause of artificially low NELM estimates.
Step 3 — Locate the target constellation. Use a red-light torch if you need to check a star map. Red light does not destroy dark adaptation the way white or blue light does. Globe at Night provides a finder chart on the campaign page.
Step 4 — Match to the reference chart. Open the Globe at Night web app at globeatnight.org/webapp or the standalone iOS/Android app. Compare the sky against the eight chart options. Pick the chart that best matches what you actually see — not the best-case version. If you are between two charts, choose the darker one.
Step 5 — Log conditions. The form asks for cloud cover (0%, 25%, 50%, 75%, or 100%). GPS location is captured automatically. Time is logged at submission. These metadata fields allow the database to filter quality observations and separate sky brightness from atmospheric variability.
Step 6 — Submit. Data uploads immediately to the Globe at Night server. Your submission appears on the interactive map at globeatnight.org/maps within minutes.
How Your Data Is Used
Every submission joins a freely downloadable database that has powered peer-reviewed science — including the most-cited recent finding on sky brightness trends.
The Globe at Night database is publicly accessible at globeatnight.org/maps. Annual datasets are available for download. Each data point carries GPS coordinates, submission time, chart match (NELM), cloud cover estimate, and the contributing observer’s anonymous session ID.
Kyba et al. (2023, Science 379: 265–268) drew on 51,351 Globe at Night submissions from 19,262 distinct locations across 2011–2022. The analysis found sky brightness increasing at 9.6% per year. No fixed monitoring array covers 180 countries with that spatial density. The citizen dataset detected what the VIIRS satellite had missed: the blue-wavelength sky brightness increase from the global LED transition. Your submission from a garden in Denmark is part of the same evidence base.
Globe at Night data has also supported regional policy work. ANPCEN, the French citizen sky monitoring association, used Globe at Night observations alongside its SQM network as part of the baseline informing the SDES national assessment — which documented France’s 19% reduction in high-level light pollution exposure between 2014 and 2023. For the French policy context, see our article on France’s 2018 lighting decree. For the scientific infrastructure that validated citizen sky measurement as a rigorous method, see our explainer on Falchi 2016 and Kyba 2023.
Tips for Reliable Measurements
The difference between a useful observation and a noise point usually comes down to one thing: dark adaptation.
Dark-adapt fully. Minimum 15 minutes. No screens, no white torches. A single glance at a bright phone screen resets rod sensitivity and costs five minutes of recovery.
Observe near the zenith. The target constellation should be reasonably high in the sky — not near the horizon where atmospheric extinction and ground-level light domes degrade the NELM estimate. Observations at low elevation angles are valid but noisier.
Log cloud cover honestly. The database uses cloud cover to weight observations. Underestimating it inflates apparent sky quality in ways that skew the aggregate.
Repeat across campaigns. Multiple observations from the same location over months or years contribute far more to trend analysis than a single point. Longitudinal data from a consistent site detects sky brightness change over years. Common errors: observing through window glass, observing from under a roof overhang, or mistaking a bright planet near the constellation for a limit-magnitude star.
Going Further: Beyond Globe at Night
Globe at Night measures NELM by constellation-matching. Two complementary tools extend the method — one for finer precision, one for fixed monitoring.
The Loss of the Night app — developed by Christopher Kyba’s group at GFZ Potsdam in collaboration with LoNNe network partners — takes a different approach. Instead of matching a whole constellation to a chart, the app guides the observer through individual star evaluations: can you see this specific star at magnitude 4.7? What about 5.1? Star-by-star evaluation produces a calibrated NELM estimate with smaller statistical uncertainty, at the cost of a longer session. It runs on Android and iOS and feeds a separate research database at GFZ Potsdam. Loss of the Night is the natural next step for anyone wanting more precision without hardware.
For those ready to invest in hardware, a SQM-LU-DL in a fixed weatherproof enclosure creates a permanent monitoring station. The TESS-W photometer from the STARS4ALL network (UCM Madrid, H2020 project 688135) is an alternative fixed-mount option with WiFi connectivity; its TESS-4C variant adds four spectral channels that capture LED blue emissions the standard SQM filter misses. Both options are covered in our SQM buyer’s guide.
A note from Lars: citizen NELM data is not a lesser form of measurement than instrument data. It is a different form — broader spatial coverage, higher per-point variance. Kyba 2023 proved that at scale it produces statistically sound science. The two approaches are complementary. For the dark sky locations across Europe where both methods have been used to characterise reference sites, see our article on dark sky places in Europe.
Frequently Asked Questions
How accurate are Globe at Night readings?
A single Globe at Night observation has a typical accuracy of ±0.5 magnitudes in NELM — equivalent to roughly one Bortle class. That uncertainty comes from observer-to-observer variation in dark adaptation, visual acuity, and matching technique. The accuracy is sufficient for regional trend analysis when aggregated across hundreds or thousands of observations. Kyba et al. (2023, Science) demonstrated this directly: 51,351 submissions produced a statistically robust +9.6%/year sky brightness trend signal that replicated the direction and approximate magnitude of what calibrated instruments show at fixed monitoring stations.
Do I need special equipment?
No equipment beyond a smartphone with GPS. The Globe at Night web app runs in any mobile browser at globeatnight.org/webapp; the standalone app is available on iOS and Android. You do not need a Sky Quality Meter, a telescope, or any astronomy background. Basic constellation familiarity helps — being able to identify Orion or Cygnus. Globe at Night’s campaign pages include finder charts if you need a starting point.
Can I participate from a bright city?
Yes — and urban observations are scientifically valuable. A submission showing only the three brightest stars of Orion are visible from central Stockholm is useful data. It maps the urban floor of sky quality the same way rural observations map the ceiling. From a bright city, expect to match Chart 1 or Chart 2 and a NELM in the 3.5 to 4.5 range. That is a valid, submittable observation. The only real constraint is a reasonably clear sky — heavy city haze or fog makes the constellation hard to identify.